
GitHub Activity Graphs are Meaningless
I don’t know if you’re aware of the trend on X where people share their GitHub Activity Graph. This is often done in good faith, where people are using the idea of public accountability to keep up their productivity.
However, there are employers who use GitHub Activity as a signal for a hardworking developer.
I’m here to tell you that is nonsense, and it’s a practice that needs to stop.
Employers Are Measuring the Wrong Thing
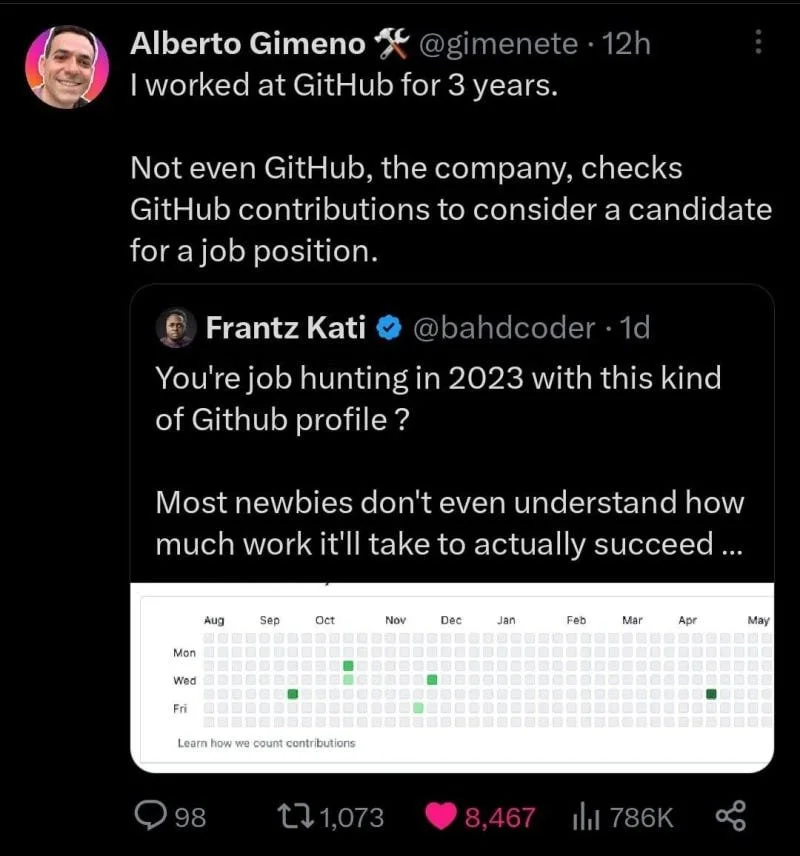
You might have seen posts on Twitter like the following.

So, if you want to succeed at this “tech thin” is it necessary for your activity graph to be wholly green?
Well, there are other explanations for a Github profile having large gaps. You might work on private repositories; you might work on an entirely different profile at work, or you might be making valid contributions sporadically. If you’re encouraging developers to make a commit before midnight to keep their streak, something is going very wrong.
Also (it’s a seemingly obvious point) quantity! = quality. A contribution tells us nothing about the quality of the commits or why they were created. A commit streak alone is not a good indicator of anything other than the fact that a contribution has been made — nothing more and nothing less.
GitHub Activity Graphs Are a Disincentive for Healthy Work Habits
When did not working on weekends become a negative for software developers, when it is a healthy behavior. Having a long streak of work means that you are not taking breaks.
If you’re not working in a sustainable way that should be a red flag for potential employers. People with a streak of over 365 days have worked a complete year without a break. That’s a concern for their well-being.
We should be rewarding people for taking breaks and encouraging healthy working habits, not celebrating toxic behavior.
We certainly shouldn’t hire people on the basis of their unhealthy behaviors.
Gamification is all good and fun and can encourage people to develop good habits. But it can also be used to encourage unhealthy habits, and this needs to stop.
Contribution graphs are good for nothing more than luring people into a daily use of GitHub.
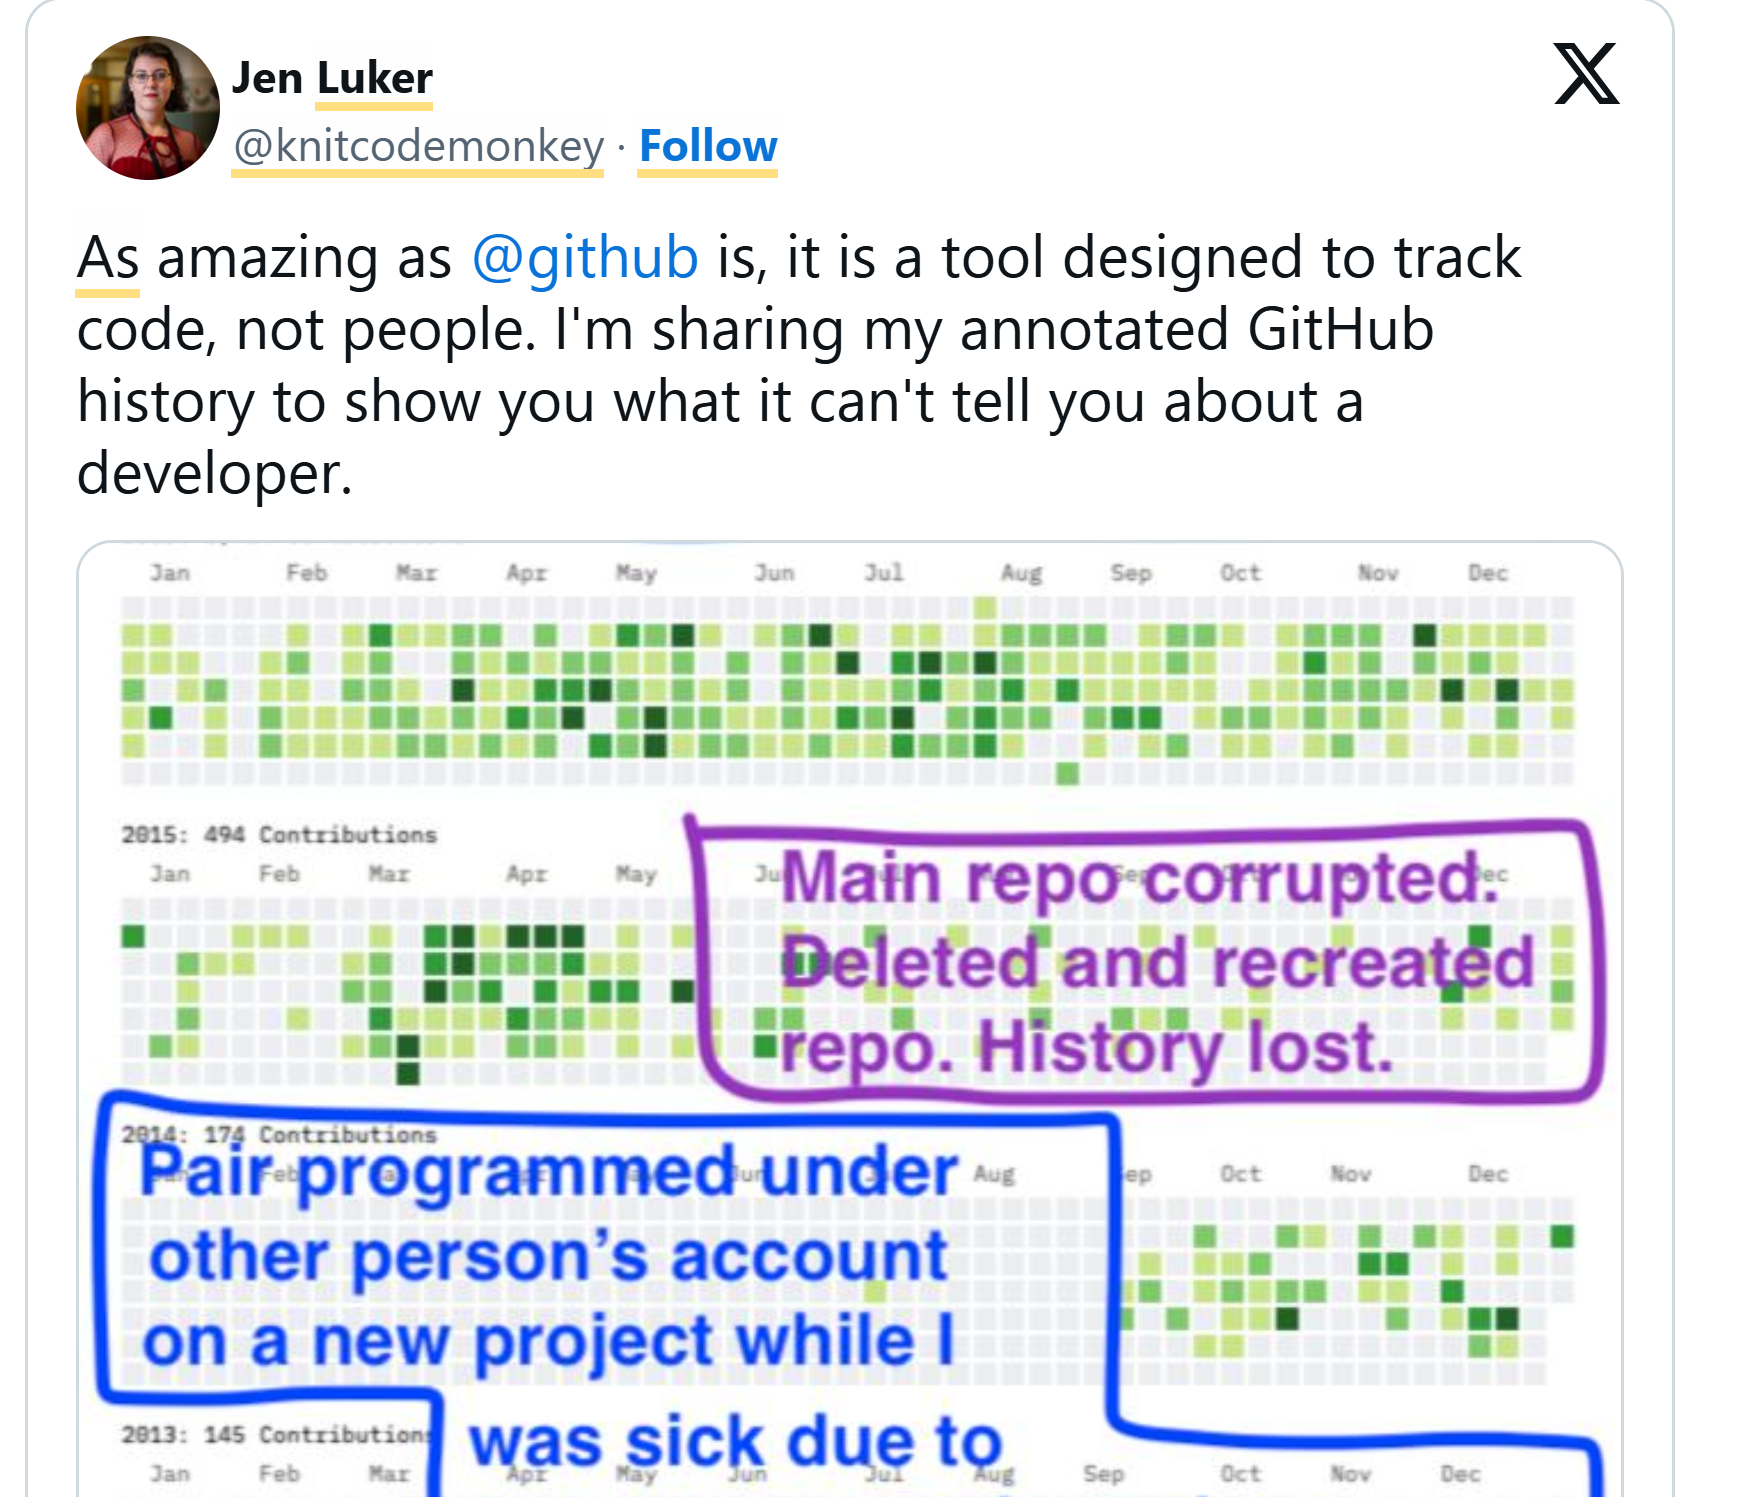
GitHub History Doesn’t Explain What Happened
I think I’ll leave the following Tweet by Jen Luker here. It stands for itself.
This is Silly
People are using their GitHub account to display fun messages.

Does this mean that they are a better, or worse developer? If you want to join into this fun here is the link:

The Counter-Point
People are responsible for their own actions. If you don’t want to commit or keep a streak running that is your own decision. Keeping a streak doesn’t mean a developer isn’t taking a break, they might spend just a few minutes updating a README — it is their choice.
If people judge your output entirely on an activity graph that is a good thing since they are marking themselves out to be poor employers who are using the available data incorrectly.
Equally a good company might use the activity to see (subjectively) how active an applicant might have been recently, as a single data point to be used amongst others.
Developers get more data about themselves (“I code more on Thursdays, I wonder why…”) and feedback about contributions to different projects.
Having GitHub Activity Graphs available and in use is a simple case of a win-win!
Conclusion
Measuring developers in this way can be damaging to junior developers, those starting and those who have taken time out (pregnancy, for example).
IMHO it is better to make a small number of worthy quality commits rather than a large number of commits that hold little to no value.
The rewards are for people doing work on as many days as possible and making contributions for multiple days in a row with no break.